Monitoring Management
Overview
Monitoring Management: The monitoring management is a monitoring system of the storage platform, consisting of operation log and an alarm center. The system helps you track the platform's operational status, quickly pinpoint issues and resolve them.
Related Definitions
- Operation Log: An operation log is a chronological record of operations on the specified resources and their results, which is convenient for troubleshooting and tracing. You can easily get the operation status of the whole platform.
- Alarm Center: Alarm Center monitors time-series data and events, displays all alarm messages of the platform, and sends alarm messages to specified endpoints in real time according to their emergencylevel, so as to facilitate timely tracking of resource usage.
- Alarm Message: An alarm message is a message sent the time when an alarm is triggered. Alarm Center displays all alarm messages of the platform.
- Alarm: An alarm is used to monitor the status of time-series data and events and respond to the status change.
- Endpoint: An endpoint is a method that users obtain subscribed messages. Endpoints are categorized into system endpoints and email.
Operation Log
Operation Log: An operation log is a chronological record of operations on the specified resources and their results, which is convenient for troubleshooting and tracing. You can easily get the operation status of the whole platform.。
Check Operation Logs
On the main menu of ZStack ZStone, choose . Then, the Operation Log page is displayed.
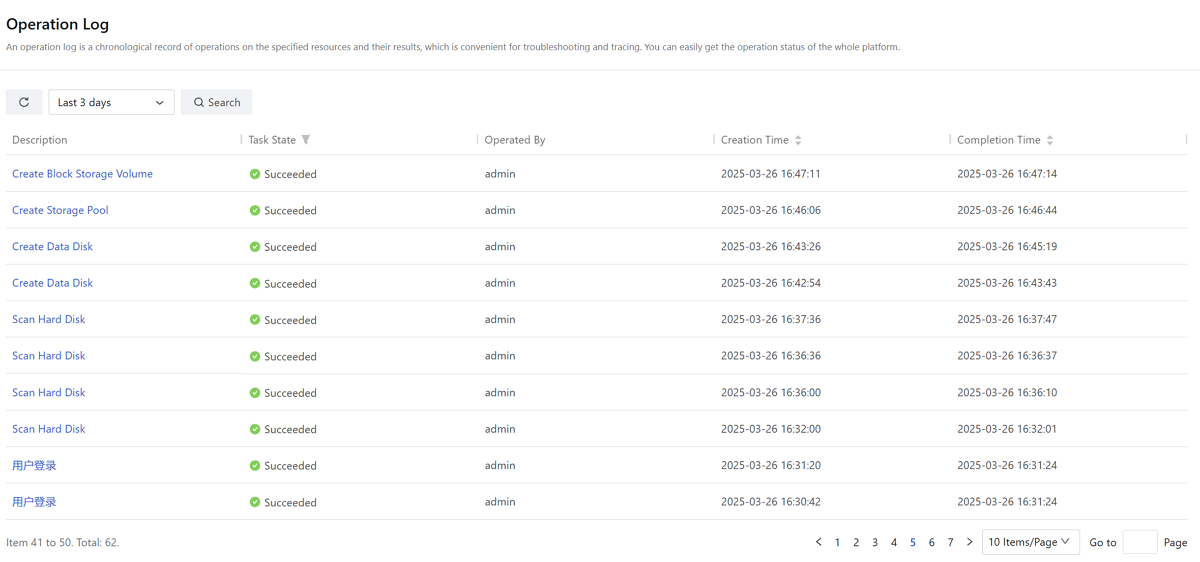
- Supports filtering logs by predefined time ranges: Last 3 days, Last 7 days, Last month.
- Supports customizing a time ranges to view logs within specific periods.
- Supports filtering operations according to task state: Succeeded, Failed, Abnormal, Ongoing, and Waiting.
- Supports setting the number of items displayed on each page (10/20/50/100) and performing pagination controls.
View Operation Details
On the main menu of ZStack ZStone, choose . On the Operation Log page, select one operation and its details page will pop up.
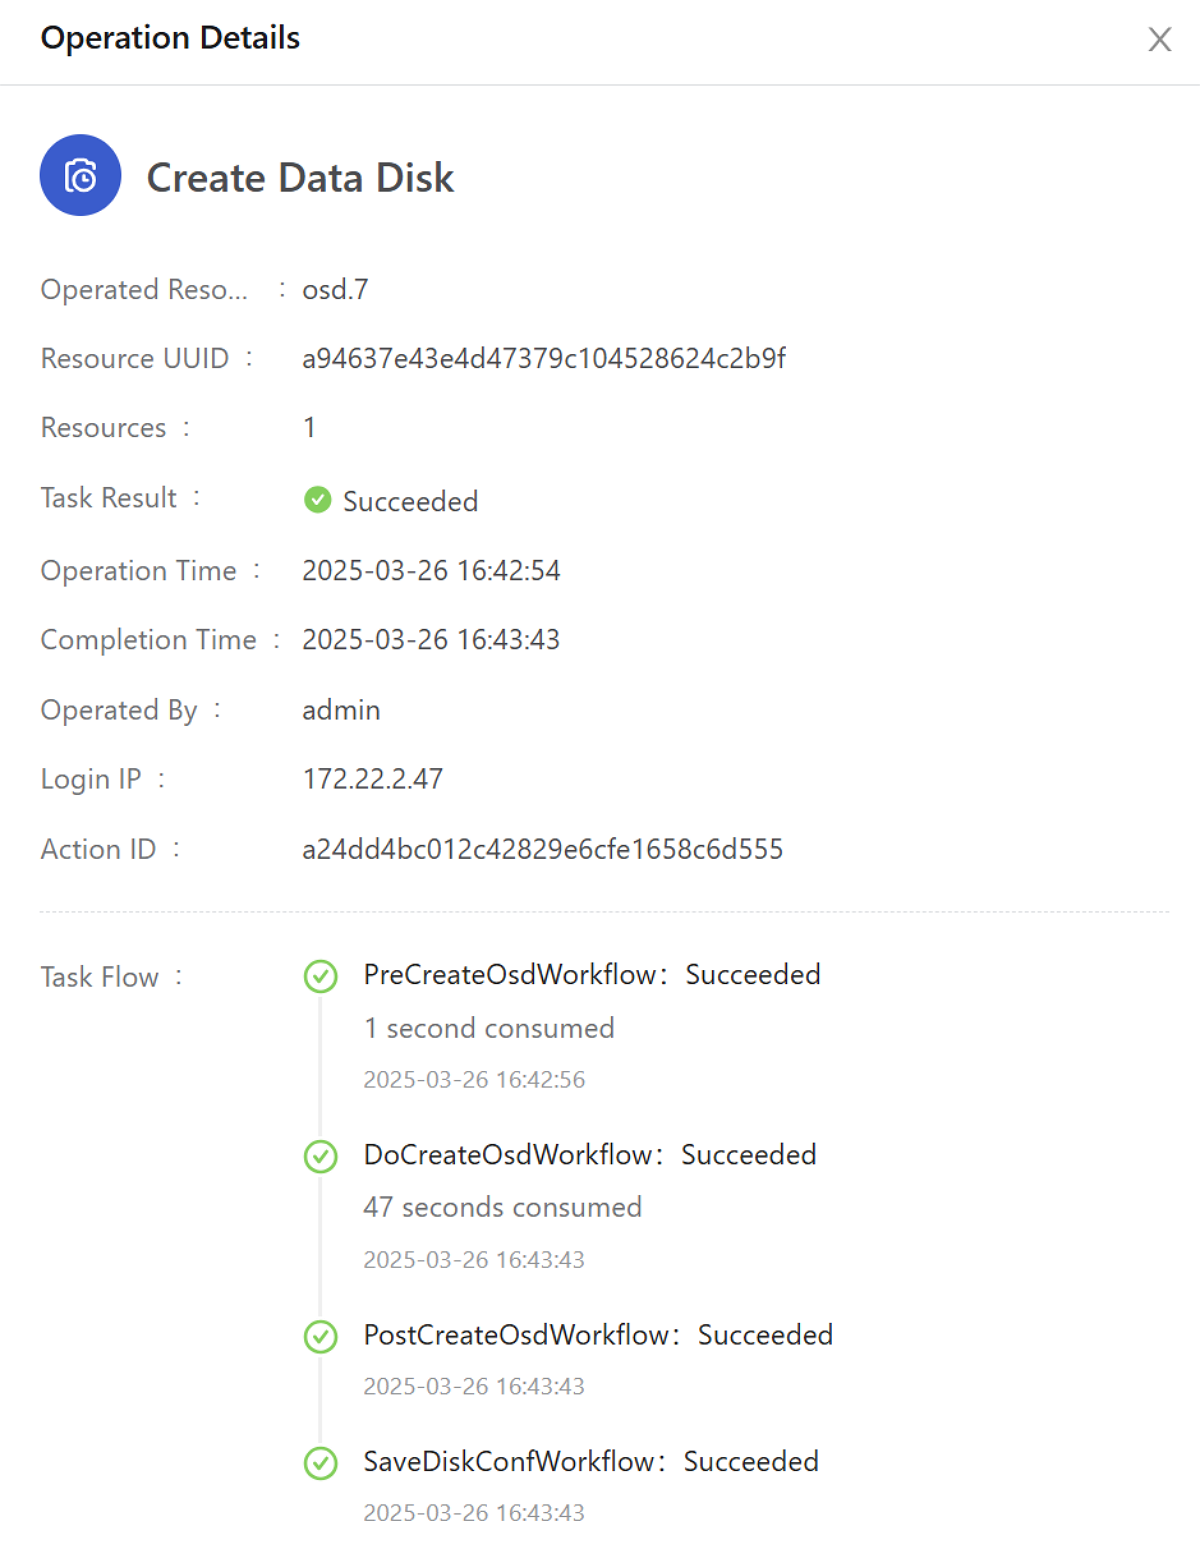
- The operation details page shows you message details returned by the operation, including the number of resources, task result, operation time, completion time, operators, login IP, action ID, task flow and so on. For failed operations, you can view specific failure causes to help quickly locate, analyze, and resolve issues.
- For bulk actions, the details page presents the subtasks' operational details, including operated resources, resource UUID, subtask ID, subtask result, and subtask flow. For failed operations, you can view specific failure causes.
Alarm Center
Alarm Message
Check Alarm Messages
On the main menu of ZStack ZStone, choose . Then, the Alarm Message page is displayed.
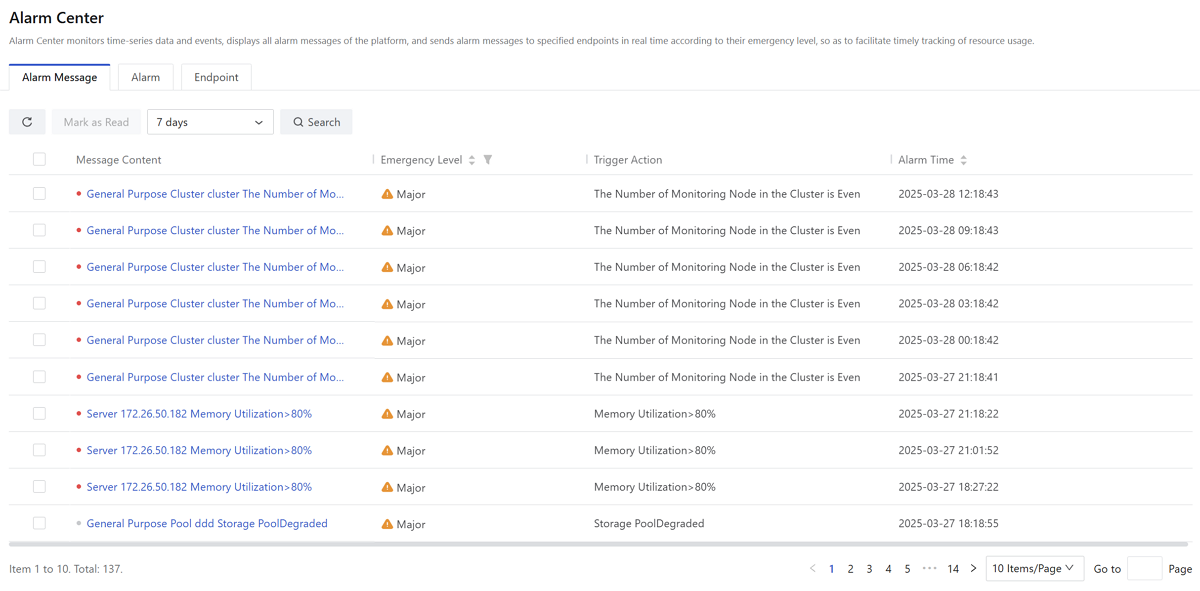
- Supports filtering alarm messages by predefined time ranges: 1 hour, 12 hours, 1 day, 7 days, 15 days, and custom.
- Supports searching alarm messages by entering Resource Name, Alarm Resource UUID, or Message UUID.
- Supports filtering alarm messages by emergency level (Emergent/ Major/ Info).
- Supports sorting alarm messages by their emergency levels and alarm time.
- Supports setting the number of items displayed on each page (10/20/50/100) and performing pagination controls.
- Supports marking one or more alarm messages as read.
 Note: We recommend that
you confirm these alarms before performing this operation.
Note: We recommend that
you confirm these alarms before performing this operation.
View Alarm Message Details
On the main menu of ZStack ZStone, choose . On the Alarm Message page, click one message's name and the Alarm Message Details page will pop up.
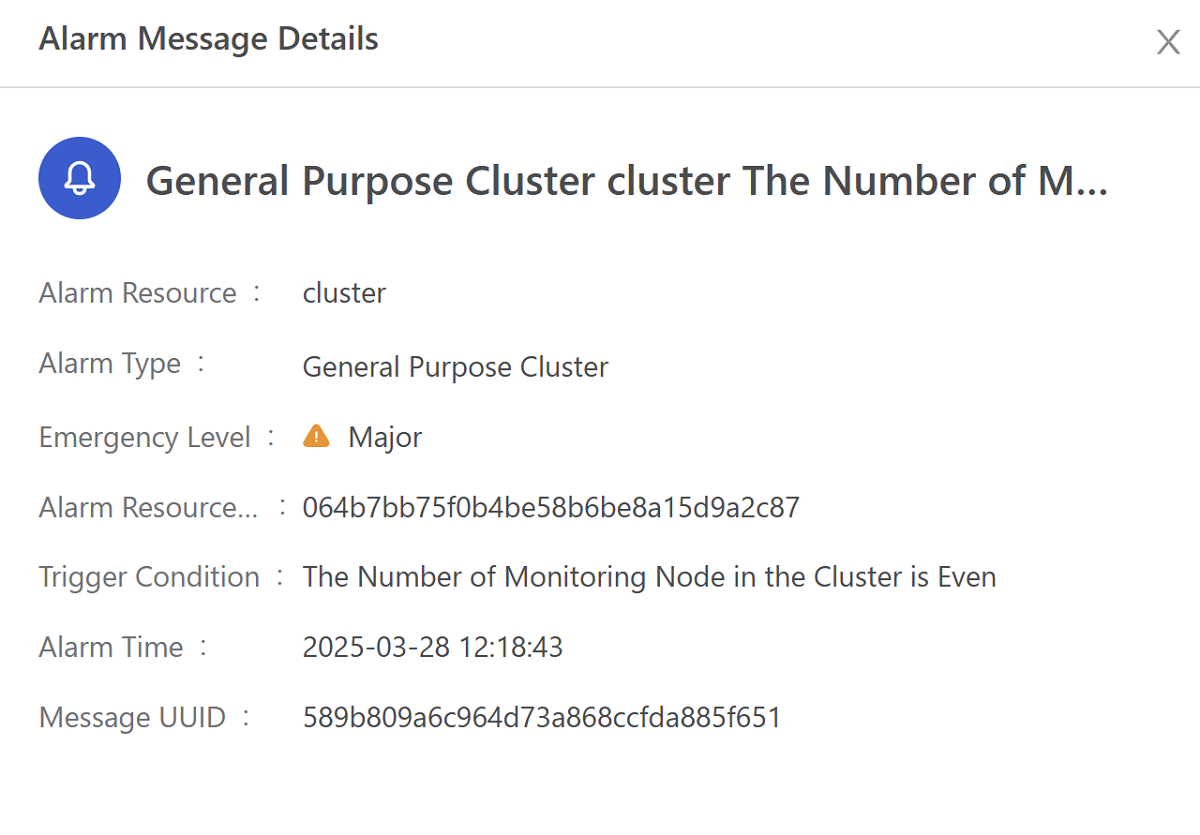
On this page, you can grasp further details about the alarm message, including alarm resource, alarm type, emergency level, alarm resource UUID, trigger condition, alarm time, and message UUID. With these details, you can quickly locate the issue and then resolve it.
Alarm
Check Alarms
On the main menu of ZStack ZStone, choose . Then, the Alarm page is displayed.
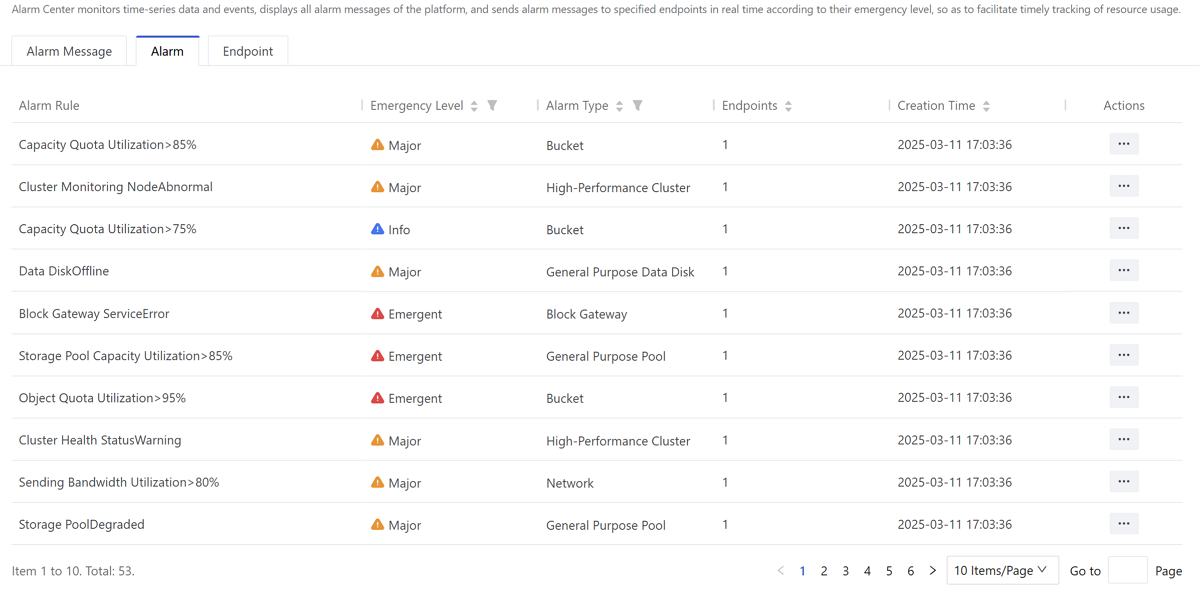
- Supports filtering alarm rules by emergency levels (Emergent/ Major/ Info).
- Supports filtering alarm rules by alarm types (Cluster/ Pool/Data Disk/Hard Disk/Server/Block Storage Volume/Network/Service/S3 Gateway/LB Listeners/Object User/Bucket/.
- Supports sorting alarm rules according to emergency levels, alarm types, the number of endpoints, and creation time.
- Supports setting the number of items displayed on each page (10/20/50/100 items/ page) and performing pagination controls.
Manage Alarms
On the main menu of ZStack ZStone, choose . Then, the Alarm page is displayed.
| Action | Description |
|---|---|
| Add Endpoint | Add endpoints for the selected alarms. |
| Remove Endpoint | Remove endpoints for the selected alarms. |
Endpoint
Create an Endpoint
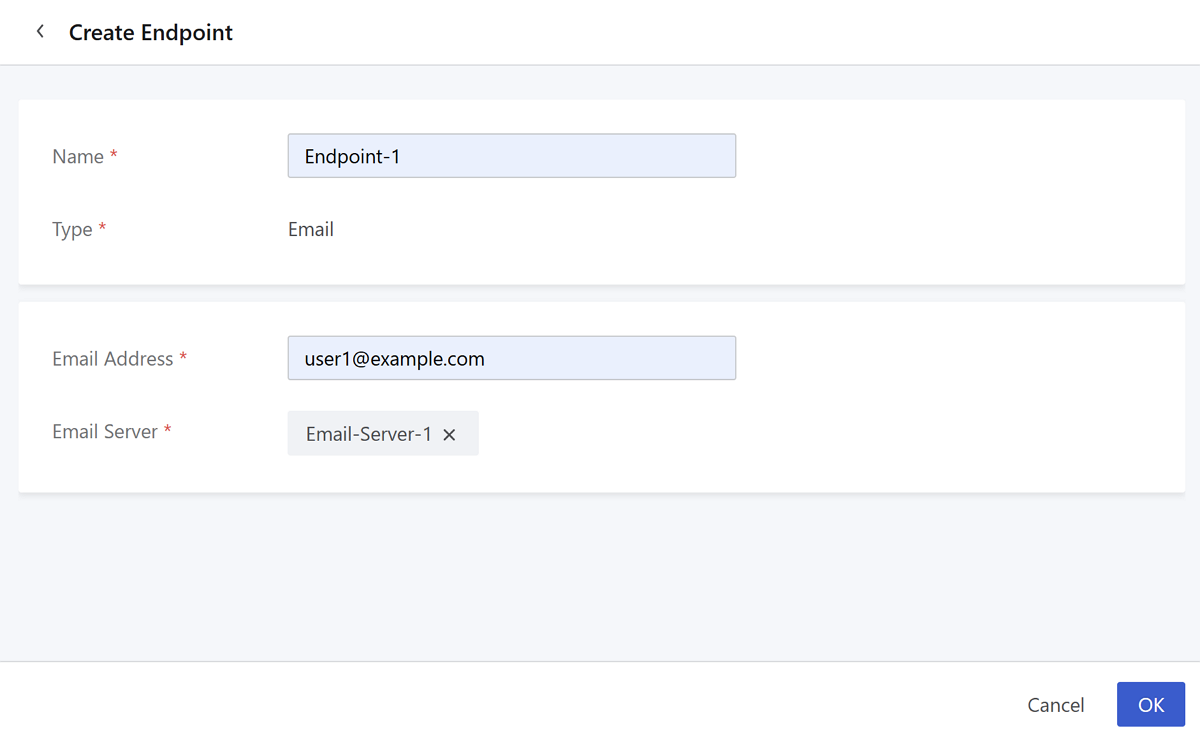
On the main menu of ZStack ZStone, choose . On the Endpoint page, click Create Endpoint.
- Name: Set the name for an endpoint.
Naming rules: 1-128 characters long. A name can only contain Chinese characters, letters, digits, spaces, hyphen (-), underscores (_), periods (.), parentheses (), colons (:), and plus signs(+). You cannot start or end with a space.
- Type: The default type is Email.
- Email Address: Enter your email address.
- Email Server: Select an available email server.
Manage an Endpoint
On the main menu of ZStack ZStone, choose . Then, the Endpoint page is displayed.
| Action | Description |
|---|---|
| Create Endpoint | Create an endpoint. |
| Delete | Delete the selected endpoint.Note: You cannot
delete the endpoint of System type. |