Cluster Overview
On the main menu of ZStack ZStone, choose Cluster Overview. Then, the Cluster Overview page is displayed. From this page, you can take a look at the big picture of the whole cluster.
The Cluster Overview page consists of two sub-pages:
General Purpose Cluster and High-Performance
Cluster. Information such as cluster storage status, cluster resource
statistics, and unread alarm statistics in recent seven days is displayed in card form.
Detailed description of these cards is as follows: Note:
Note:
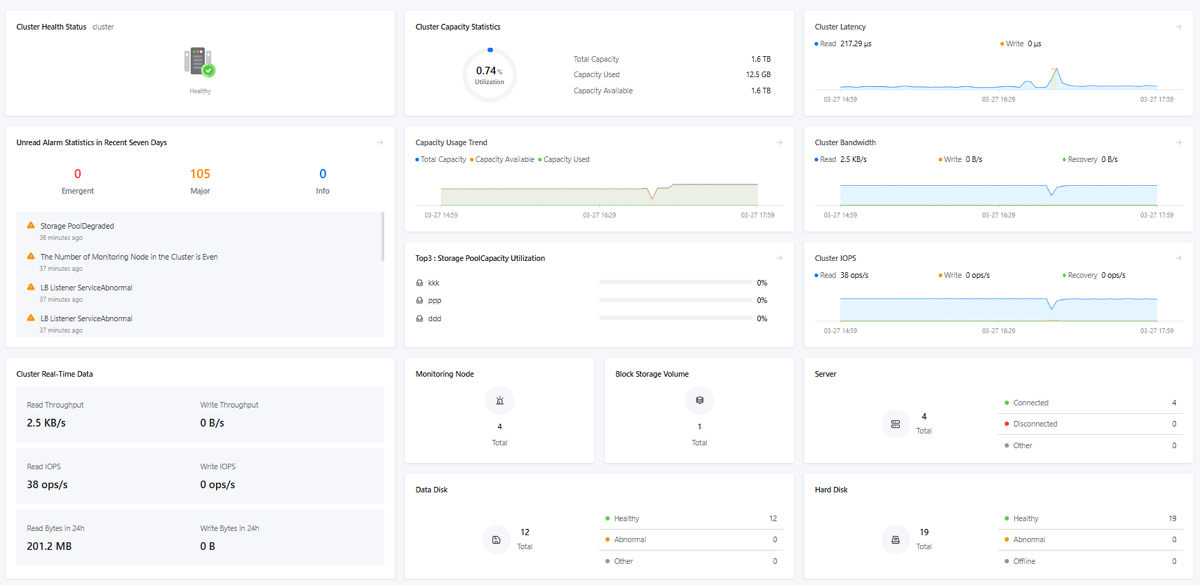
- Cards related to cluster storage status:
- Cluster Health Status: Shows the health status of the current cluster.
- Cluster Capacity Statistics: Shows the total capacity, capacity used, and capacity available of the current cluster. Also, the utilization rate is shown in a doughnut chart.
- Cluster Real-Time Data: Shows the monitoring data of the current cluster, namely, read throughput, write throughput, read IOPS, write IOPS, read bytes in 24h, and write bytes in 24h.
- Cluster Performance Monitoring: Contains three cards including cluster IOPS, cluster bandwidth and cluster latency. In each card, a line graph is provided to illustrate the real-time IOPS, bandwidth, and latency of the current cluster respectively. Click the "More" button in the upper-right corner of any card, you can navigate to the details page of Cluster Performance Monitoring. You can check the graphs by setting two parameters: monitoring value (Read/ Write/ Recovery) and time span (15 minutes/1 hour/6 hours/1 day/1 week/1 month/1 year/custom).
- Capacity Using Trend:Dynamically shows the real-time capacity using trend through a line graph. The three items, total capacity, capacity available, and capacity used, are illustrated in the graph. Click the "More" button in the upper-right corner of this card, you can navigate to the details page of Capacity Using Trend. You can check the graph by setting time span (15 minutes/1 hour/6 hours/1 day/1 week/1 month/1 year/custom).
- Cards related to cluster resource statistics:
- Monitoring Node: Counts the total number of the monitoring nodes within the cluster.
- Hard Disk: Shows the number of hard disks in different status (Healthy/Abnormal/Offline), and counts the total number of hard disks within the cluster.
- Server: Shows the number of servers in different status (Connected/Disconnected/Other), and counts the total number of servers within the cluster.
- Data Disk: Shows the number of data disks in different status (Healthy/Abnormal/Other), and counts the total number of data disks within the cluster.
- Top3: Storage Pool Capacity Utilization: Lists the top three storage pools in terms of capacity utilization. Click the "More" button in the upper-right corner of this card, you can navigate to the Storage Pool page where you can check the usage of all storage pools.
- Block Storage Vol: Counts the total number of block storage volumes within the cluster.
- Unread Alarm Statistics in Recent Seven Days:
- Displays unread alarm messages from the past 7 days categorized by emergency levels (Emergent/Major/Info).
- Shows at most 10 alarm messages in a scrollable list form.
- Click the "More" button in the upper-right corner of this card, you can navigate to the Alarm Center page and check all alarm messages.
- Click the alarm item to read the alarm message content.
Note:
- Each time you enter or refresh the Cluster Overview page, the latest data is retrieved and displayed in real time.
- The modules containing charts or graphs automatically refresh data every 30 seconds by default.
- Charts involving status statistics adopt a unified color scheme: green for normal status, yellow and red for abnormal status, and gray for other/offline status. This makes it easy for you to quickly identify resource health status.
- In the doughnut chart, the color of the progress bar changes as the percentage of resource utilization changes: blue (less than 60%), yellow (greater than or equal to 60% and less than 80%), and red (greater than or equal to 80%).