O&M
CloudFormation
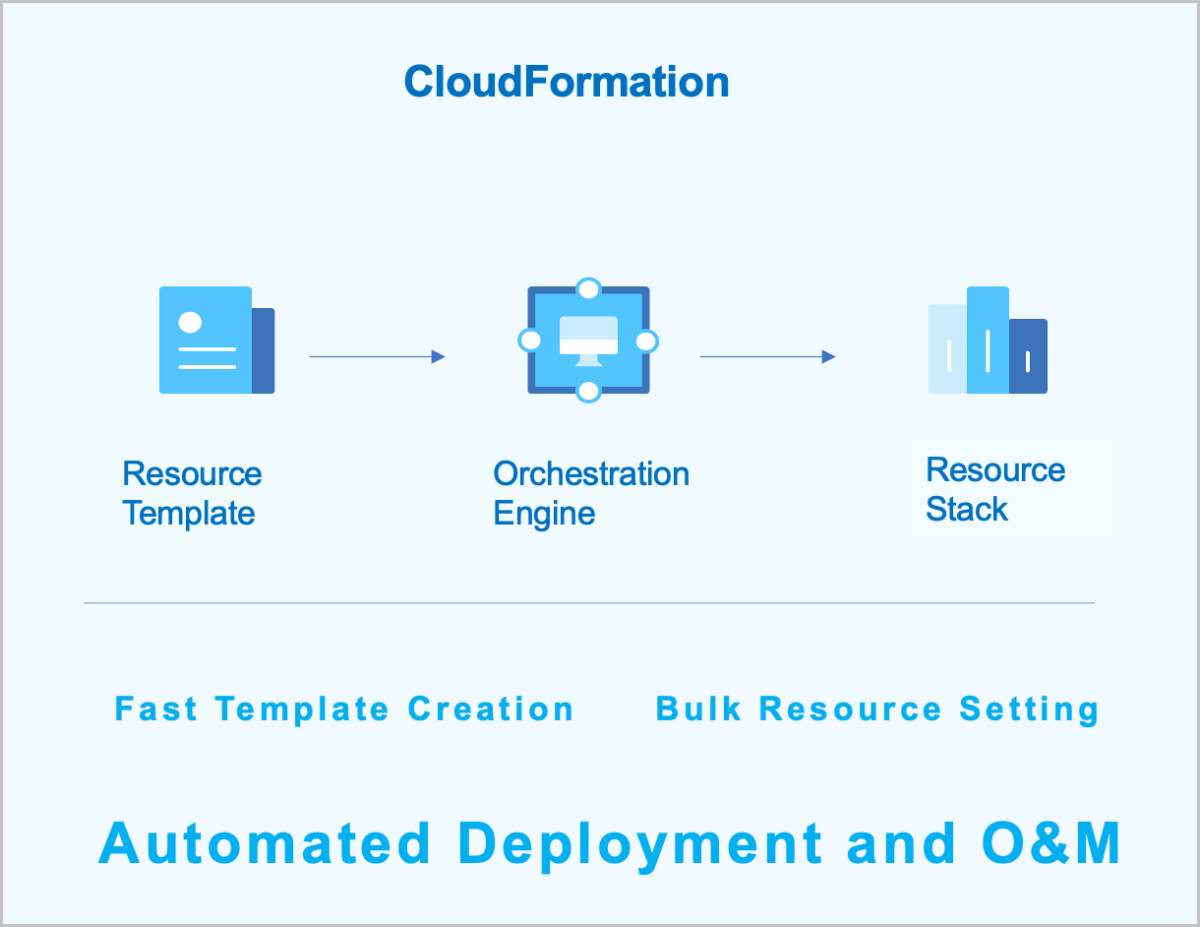
CloudFormation: CloudFormation is a service that simplifies the management of cloud resources and automates deployment and O&S. You can create a stack template to configure cloud resources and their dependencies. This way, resources can be automatically configured and deployed in batches. CloudFormation provides easy management of the lifecycle of cloud resources and integrates automatic O&S into API and SDK.
Characteristics
- You can create a new resource stack or modify an existing one to define the required cloud resources, their dependencies, and configurations. The CloudFormation will then automatically create and configure all resources through its orchestration engine.
- ZStack Cloud provides sample templates and a designer to help you create resource stack templates quickly.
- You can dynamically modify the resource stack template based on business requirements, allowing the resource stack to adapt flexibly to evolving needs.
- If a resource stack is no longer required, you can delete the entire stack and all its contained resources with a single click.
- You can reuse existing stack templates to quickly duplicate complete sets of resources, eliminating the need for repetitive configuration.
- You can flexibly combine various cloud services based on different scenarios to meet the needs of automatic maintenance.
Management Node Monitoring
In a dual-management node HA scenario, you can intuitively view the health status of each management node.
- Monitor IP reachability: Monitors whether the monitor IP for determining the reachability of the primary and standby management nodes is reachable. If unreachable, the management node high availability function may fail.
- Peer management node reachability: Monitors whether the standby management node is reachable. If the standby management node is unreachable, communication with it cannot be established.
- VIP reachability: Monitors whether the VIP is reachable. If the VIP is unreachable, the primary management node cannot be accessed via the VIP through the UI interface.
- Database status: Monitors the database status. If the database is abnormal or the databases on the dual management nodes are out of sync, there may be a risk of data loss. Restore normal operation promptly.
Monitoring and Alarm
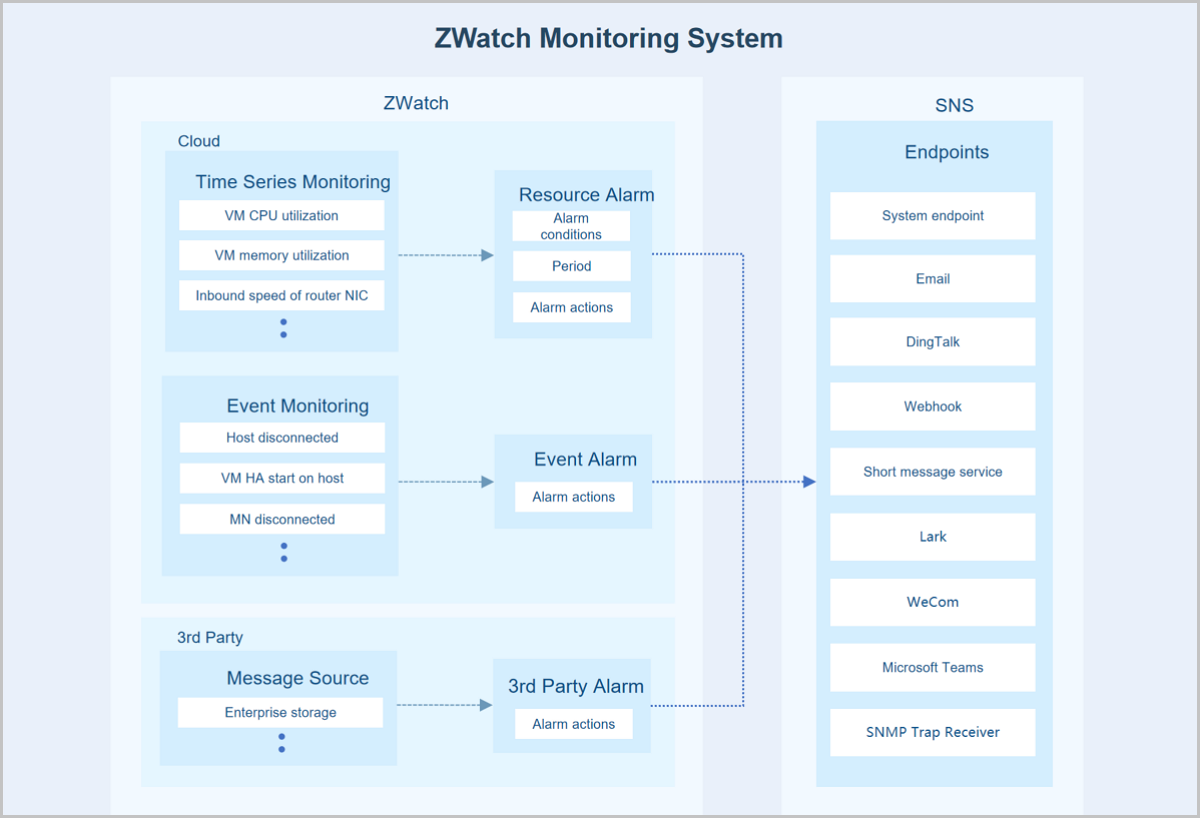
Monitoring and alarm supports monitoring time-series data (such as resource load and capacity data) and predefined system events. It pushes alarms to specified endpoints through the SNS. The supported alarm types include resource alarm, event alarm, and extended alarm. Supported endpoint types include system, email, DingTalk, WeCom, Lark, Webhook, SMS, Microsoft Teams, and SNMP Trap. Some resource alarms require an installed agent to function.
Prometheus provides time-series monitoring data. When monitoring business data, Prometheus uniformly collects different data.
In the Prometheus architecture, the Prometheus server does not directly monitor specific targets. Its core functions are data collection, storage, and providing external data query support. Therefore, to acquire sample data, such as the host CPU usage, an Exporter is used to periodically gather monitoring samples. ZStack Cloud employs both pull and push modes to collect monitoring data from different monitoring targets. When hosts or external VM metrics are the monitoring targets, the Prometheus service periodically uses the pull mode to collect data gathered by the Exporter on the hosts.
Additionally, due to network or security constraints, Prometheus might not be able to directly access the interiors of cloud VMs or bare metal servers. In such cases, a Pushgateway acts as an intermediary to facilitate data transfer. The data collection agent still uses an Exporter to gather monitoring metrics but employs a push mode to periodically send this data to the Pushgateway. Prometheus then uses its pull mode to collect the data from the Pushgateway, thereby achieving unified data collection.
One-Click Inspection
The one-click inspection feature enables comprehensive, one-click health checks on critical resources and services. It assigns a health score to each inspected resource and service based on the results, while also providing inspection recommendations and a detailed report. This facilitates efficient operations and maintenance, helping to ensure your cloud resources and services remain in optimal condition. One-click inspection is suitable for scenarios requiring centralized and efficient operational management of ZStack Cloud.
- Platform: Inspects the platform's foundational services and operational status.
- Compute: Inspects the usage and operational status of the platform's physical and virtual compute resources.
- Network: Inspects the configuration and status of the platform's physical and virtual networks.
- Storage: Inspects the usage and operational status of the platform's physical storage resources.
- Global Settings: Inspects the configuration of globally significant resources within the platform.
You can selectively perform one-click inspections by customizing the inspection items based on category. After initiating an inspection, ZStack Cloud conducts health checks on the resources or services associated with the selected items. The one-click inspection feature includes a built-in health scoring mechanism that quantifies the health status of the inspected resources or services. This helps you intuitively and accurately grasp the overall operational state of ZStack Cloud.