One-Click Inspection
What is One-Click Inspection?
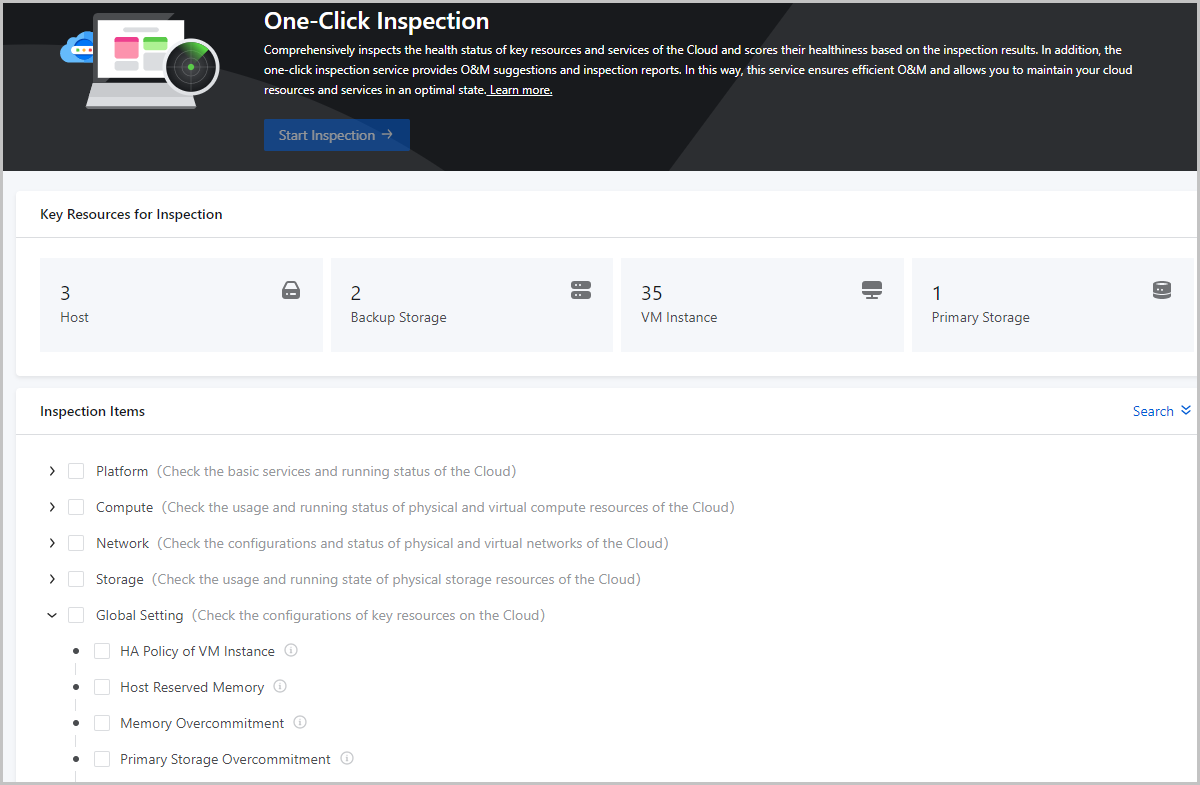
One-Click Inspection: Comprehensively inspects the health status of key resources and services of the Cloud and scores their healthiness based on the inspection results. In addition, the one-click inspection service provides O&M suggestions and inspection reports. One-click inspection is applicable to centralized O&M scenarios.
Concepts
- Inspection Categories and Items:One-Click Inspection provides five inspection categories, including platform, compute resources, network resources, storage resources, and global settings. You can use the service to inspect key resources and services of the Cloud, such as the management node, hosts, VM instances, image storage, primary storage, physical and virtual NICs and networks, and licenses.
- Platform: Check the basic services and running status of the Cloud.
- Compute: Check the usage and running status of physical and virtual compute resources of the Cloud.
- Network: Check the configurations and status of physical and virtual networks of the Cloud.
- Storage: Check the usage and running status of physical storage resources of the Cloud.
- Global Setting: Check the configurations of key resources of the Cloud.
After you select items from certain inspection categories and launch inspection, related resources or services are inspected and their healthiness is scored. For more information about inspection items, see Inspection Items.
- Inspection Results:One-Click Inspection provides four inspection results, including Normal, Warning, Fault, Failed.
- Normal: The inspected resources or services are in normal status. This result is marked with a green icon.
- Warning: The health status of inspected resources or services is compromised, which may to some extent affect their performance and stability. This result is marked with a yellow icon.
- Fault: The inspected resources or services are in critical condition and may seriously affect business operations. This result is marked with a red icon.
- Failed: The inspection on related resources or services fails, which may seriously affect business operations. This result is marked with a grey icon.
- Healthiness Scoring:
One-Click Inspection provides an in-built healthiness scoring mechanism for Cloud resources and services. It allows you to grasp the overall running status of the Cloud in a visualized way.
Scoring on inspected resources/services: Scores resources and services based on the inspection results of related resource and service attributes.- If all attributes of a resource or service under inspection are in Normal status, the inspection result of the resource or service is Normal. The score is 100 points.
- If one attribute of a resource or service under inspection is in Warning state and the other attributes are in Normal status, the inspection result of the resource or service is Warning. The score is 50 points.
- If one attribute of a resource or service under inspection is in Fault or Failed state, the inspection result of the resource or service is Fault or Failed. The score is 0 points.
Scoring on inspection items: Scores inspection items based on the inspection results of related resources and services.-
If an inspection item does not belong to the Global Setting category, the inspection item is scored based on the following mechanism:
- Score of Inspection Item = (Score of Resource 1 + Score of Resource 2 + …… + Score of Resource N)/(N*100)*100
- For example, if an inspection item involves 3 resources, which are in Normal, Warning, and Fault/Failed status respectively, the scores of the three resources are 100, 50, and 0 points respectively. Then the score of the inspection item is (100 + 50 + 0)/(3*100)*100=50 points.
-
If an inspection item belongs to the Global Setting category, the inspection item is scored based on the following mechanism:
- The score of the inspection item is the score of the involved global setting.
- For example, if the inspection result of the involved global setting is Warning, the score of the global setting is 50 points. Then the score of the inspection item is 50 points.
Scoring on the Cloud: Scores the Cloud based on the scores of all inspection items.- Score of the Cloud = (Score of Inspection Item 1 + Score of Inspection Item 2 + …… + Score of Inspection Item N)/(N*100)*100
- For example, if you select 3 inspection items, which is scored 100 points, 50 points, and 0 points respectively, then the score of the Cloud is (100 + 50 + 0)/(3*100)*100=50 points.
- O&M Suggestions:
If resources and services are detected in Warning or Fault status, One-Click Inspection analyzes the hidden dangers and their effects on these resources and services, and provides suggestions on O&M. For more information, see Inspection Items.
- Inspection Reports:
One-Click Inspection allows you to export PDF-formatted inspection reports. An inspection report summarizes platform configurations, resource status, and inspection results. It also provides details of all abnormal inspection items and corresponding O&M suggestions.
Benefits
- Comprehensive, customized, and efficient inspection capabilities: Provides five inspection categories that cover all key resources and services of the Cloud and allows you to select inspection items based on your business scenarios. After you launch an inspection, the inspection can be completed within a few minutes.
- Multi-layered scoring mechanism: The in-built three-layer mechanism of scoring on resources/services, inspection items, and the Cloud allows you to grasp the overall picture as well as details of the Cloud running status.
- Intelligent O&M suggestions: Provides risk analysis of resources and corresponding countermeasures, facilitating efficient O&M.
Manage One-Click Inspection
On the main menu of ZStack Cube Ultimate, choose . Then, the One-Click Inspection page is displayed.
| Action | Description | Inspection Status |
|---|---|---|
| Start Inspection | Launches inspection on selected items. | / |
| Pause Inspection | Pauses inspection on selected items. | Inspecting |
| Resume Inspection | Resumes inspection on selected items. | Paused |
| Cancel Inspection | Cancels inspection on selected items. | Inspecting |
| Reinspect | Reinspects items that were last inspected. | Inspection Completed |
| Export Inspection Report | Export an PDF-formatted inspection report. | Inspection Completed |
Check Inspection Results
On the main menu of ZStack Cube Ultimate, choose . Then, the One-Click Inspection page is displayed. Select inspection items and click Start Inspection. After the inspection is completed, you can check the inspection results.
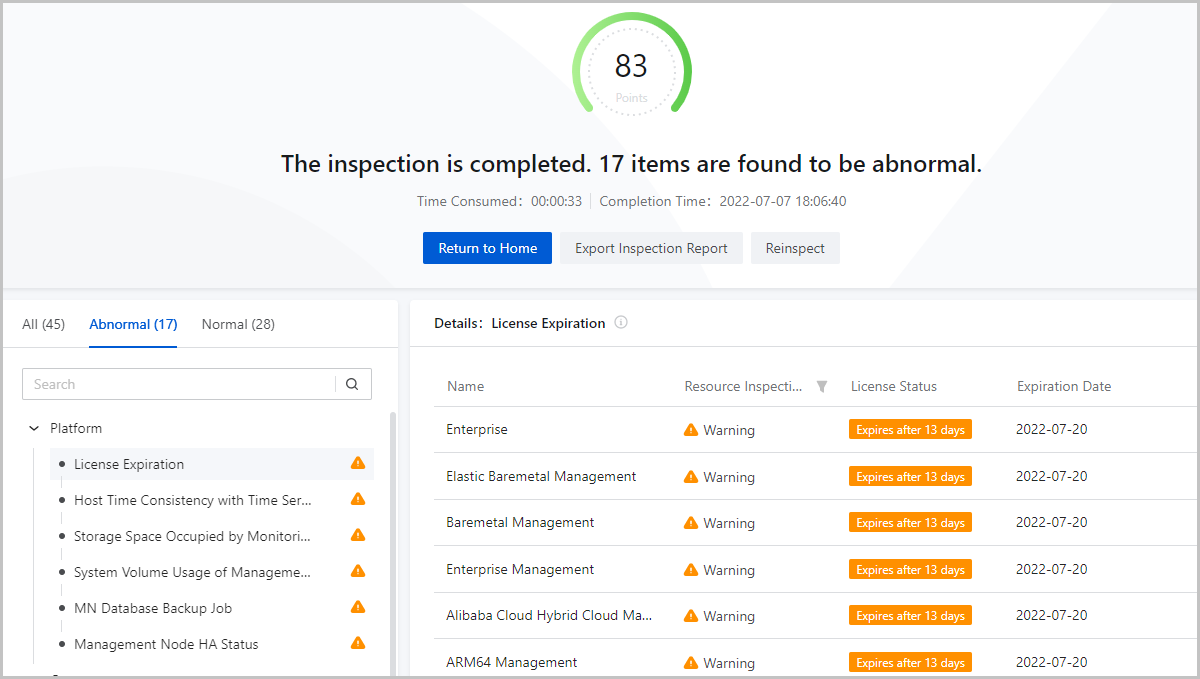
On the inspection result page, an overall score is presented for selected inspection items. These inspection items are categorized based on their status so you can quickly locate abnormal inspection items. In addition, the information and status of resources involved in each inspection item are presented in tables. O&M suggestions are also provided.
Overall Inspection Result
On the upper half of the inspection page, the number of total inspected items and that of abnormal items are presented. A score is also provided based on the in-built scoring mechanism to indicate the health status of Cloud resources and services involved in the selected items. In addition, the time consumed for this round of inspection and the time at which the inspection is completed are also recorded so you can properly arrange subsequent inspections. For more information about the healthiness scoring mechanism, see Healthiness Scoring.
Inspection Items Categorized based on Status
- If the inspection results of all resources and services involved in an inspection item are Normal, the inspection item is marked with a green icon and categorized as Normal.
- If the inspection results of all resources and services involved in an inspection item are Warning, or the inspection results of some resources and services are Warning while others are Normal, the inspection item is marked with a yellow icon and categorized as Abnormal.
- If the inspection results of all resources and services involved in an inspection item are Fault, or the inspection results of some resources and services are Fault while others are Normal or Warning, the inspection item is marked with a red icon and categorized as Abnormal.
- If the inspection results of all resources and services involved in an inspection item are Failed, or the inspection results of some resources and services are Failed while others are Normal, Warning, or Fault, the inspection item is marked with a grey icon and categorized as Abnormal.
Inspected Resource Details and O&M Suggestions
- Table Information:
- Basic information: One-Click Inspection presents different information for different inspected resources and services. For example, for the item Image Storage Status, the name, type, and status of the image storage on the Cloud are presented.
- Inspection results: One-Click Inspection provides four inspection
results, including Normal, Warning, Fault, Failed.
- Normal: The inspected resources or services are in normal status. This result is marked with a green icon.
- Warning: The health status of inspected resources or services is compromised, which may to some extent affect their performance and stability. This result is marked with a yellow icon.
- Fault: The inspected resources or services are in critical condition and may seriously affect business operations. This result is marked with a red icon.
- Failed: The inspection on related resources or services fails, which may seriously affect business operations. This result is marked with a grey icon.
-
If resources and services are detected in Warning or Fault status, One-Click Inspection analyzes the hidden dangers and their effects on these resources and services, and provides suggestions on O&M. For more information, see Inspection Items.
Inspection Items
| Category | Inspection Item | Description | O&M Suggestions |
|---|---|---|---|
| Platform | License Expiration | Check whether the base license and module licenses of the Cloud are soon to expire or have expired. | If detected that the base license of the Cloud is soon to expire or have expired, to ensure the Cloud works as expected, contact related personnel and update the license. |
| Host Time Consistency with Time Server | Check whether time sync with the time server is configured for a host and whether the time sync configuration of a host in a cluster is consistent with other hosts in the cluster. | If detected that the time server configured for some hosts in a cluster is not consistent with the time server configured for other hosts in the cluster, SSH to related host systems and check the time server configurations. | |
| Storage Space Occupied by Monitoring Data | Check the proportion of the storage space taken up by Cloud monitoring data to the MN volume where the data is stored. | If detected that the Cloud monitoring data occupies over 50% of the storage space of the MN system volume, go to Global Setting and modify the reserved monitoring data size or the retention period of monitoring data. | |
| System Volume Usage of Management Node | Check the storage usage and utilization of the system volume of the management node on the Cloud. | If detected that the usage of the system volume of the Cloud management node exceeds 70%, SSH to the MN system and clean up data insensitive to the business. | |
| MN Database Backup Job | Check whether remote backup is configured for the MN database and whether the configuration takes effect. |
If detected that the remote backup mechanism is not configured for the management node (MN) database, SSH to the MN system and check whether crontab scheduled job is configured. If detected that the remote backup mechanism configured for the management node (MN) database does not take effect, SSH to the MN system and check whether password-free login to a specified backup server is allowed. |
|
| Management Node HA Status | Check whether high availability (HA) service is configured for the Cloud management node and whether the HA service works as expected. |
If detected that the HA service is not configured for the Cloud management node, to ensure high availability of the Cloud, we recommend that you configure this service as soon as possible. If detected that the HA service of the Cloud management node is in abnormal state, check the system status of the management node as soon as possible. |
|
| Backup Server Storage Usage | Check the storage usage of local and remote backup servers on the Cloud. |
If detected that the storage usage of backup servers is no lower than 70% and no higher than 90%, delete expired backups or expand the storage capacity of the backup servers. If detected that the storage usage of backup servers is no lower than 90%, this may make backup jobs unable to be executed. Delete expired backups or expand the storage capacity of the backup servers. |
|
| Compute | Host CPU | Check the status and temperature of every host CPU on the Cloud. |
If detected that the CPU temperature of some hosts has kept no lower
than 80℃ for 5 minutes, sustained high temperature may cause hosts
to run unstably, auto power off or restart, and thus interrupt
application workloads running on VM instances. Troubleshooting:
If detected that the CPU of some hosts is offline, this may cause hosts to run unstably, auto power off or restart, and thus interrupt application workloads running on VM instances. |
| Host Memory | Check the memory utilization, SWAP utilization, and ECC warnings of hosts on the Cloud. | If detected that the memory of hosts are in warning state, it may
cause host OOM errors, deteriorate host performance, and interrupt
application workloads running on VM instances. Troubleshooting:
|
|
| Average CPU Utilization of Host | Check the average CPU utilization of hosts on the Cloud. |
If detected that the average CPU utilization of some hosts exceeds 70%, log into the host system and check whether there are abnormal processes running on the hosts. If it is not the case, we recommend that you add more hosts to the cluster where the preceding hosts reside. If detected that the average CPU utilization of some hosts exceeds 90%, log into the host system and check whether there are abnormal processes running on the hosts. If it is not the case, we recommend that you add more hosts to the cluster where the preceding hosts reside as soon as possible. |
|
| System Volume Usage of Host | Check the storage usage and utilization of the system volume of the hosts on the Cloud. | If detected that the storage usage of the system volumes of some hosts exceeds 70% or even 90%, log into the host system and cleanup data insensitive to your business. | |
| VM Instances on Host | Check the number of running VM instances on the hosts of the Cloud. | If detected that the number of running VM instances on a host exceeds 20, check the resource usage of hosts and hot migrate VM instances as needed so that host resource usage is balanced. | |
| Host Status | Check whether hosts on the Cloud are disconnected. | If detected that hosts on the Cloud are disconnected, check the system status of related hosts as soon as possible. | |
| Host System Password Strength | Check whether the root password strength of hosts on the Cloud suits the actual business scenarios. | If detected that the root password of hosts is weak, we recommend that you reset a password that is at least 8 characters in length and contains digits, letters and special characters. | |
| Host SWAP | Check whether SWAP is disabled for hosts on the Cloud. |
If detected that SWAP is not disabled for hosts on the Cloud, this may affect application workloads running on VM instances. We recommend that you log into the system of related hosts and disable SWAP for these hosts. If detected that distributed storage is added to the Cloud and SWAP is not disabled for hosts, this may seriously affect application workloads running on VM instances. Log into the system of related hosts and disable SWAP for these hosts as soon as possible. |
|
| Host Zombie Process | Check the number of zombie processes running on the hosts. | If detected that zombie processes are running on hosts, it may be because some VM instances or other system processes running on the hosts do not exit as expected. Zombie processes may cause VM launch failures or host disconnection. Check the services provided by the zombie processes. You can implement VM migrations and restart the hosts as needed. | |
| Running State of HA VM Instance | Check the running status of HA-enabled VM instances on the Cloud. | If detected that VM instances for which HA is enabled are not running, check whether these VM instances work as expected. | |
| Average CPU Utilization of VM Instance | Check the average CPU utilization of running VM instances on the Cloud. | If detected that the average CPU utilization of some VM instances exceeds 80% or even 95%, log into the system of the VM instances and check whether there are abnormal application workloads. Optimize the workloads or upgrade the instance offering as needed. | |
| Storage Usage of VM System Volume | Check the storage usage of VM system volumes (non-thick provisioned system volumes) on the Cloud. | If detected that the storage usage of VM system volumes (non-thick provisioned system volumes) exceeds 70% or even 90%, log into the VM system and cleanup data insensitive to your business. You can also expand the system volume capacity as needed. | |
| Error Policy-Enabled VM Instance State | Checks whether errors occur to the VM instances for which the error policy is enabled. | If detected that VM instances are in fault state, check whether the system of the VM instances works as expected. | |
| Long Stopped VM Instance | Check whether there are VM instances stopped for over 30 days. | If detected that VM instances have been stopped for 30 days or even longer, check whether these VM instances run application workloads. If they do not, delete these VM instances to release resources. | |
| Network | Host NIC | Check the NIC status, connection mode, packet loss rate, speed, and duplex mode of host NICs. | If detected that the NICs of hosts are in warning
state, this may cause host disconnection and affect data transmissions
of business networks. Troubleshooting:
|
| Bonded NIC Port Status of Host | Check whether the port state of the host NICs for which bonding are configured is UP. | If detected that the port state of the host NICs for which bonding are configured is DOWN, check whether related host NICs are faulted. | |
| Business Network Redundancy | Check whether network bonding is configured for the physical NIC ports of business networks on the Cloud. | If detected that network bonding is not configured for the physical NIC ports of business networks, network redundancy is in short. Check whether network bonding is necessary. | |
| Host Management Network Connectivity | Check whether the management network IP addresses of hosts on the Cloud are connected to each other. | If detected that the management network IP addresses of some hosts on the Cloud cannot be connected to each other, check whether the system of related hosts is in normal health status. | |
| Packet Loss on Management Network of Host | Check whether packet loss occurs during data communications with the management network IP address of hosts on the Cloud. |
If detected that the management network IP address of hosts are inaccessible and the packet loss rate is 100%, check whether the host system is in normal state. If detected that the management network IP address of hosts are inaccessible and the packet loss rate is 100%, check whether the host system is in normal state. |
|
| Packet Loss on Storage Network of Host | Check whether packet loss occurs during data communications with the storage network IP address of hosts on the Cloud. |
If detected that packet loss occurs during data communications with the storage network IP address of hosts, check whether the physical link layer of the host works as expected and whether the physical NICs are faulted. If detected that the storage network IP address of hosts are inaccessible and the packet loss rate is 100%, check whether the host system is in normal state. |
|
| Storage | Host HDD | Check the health status, IO utilization, and bad sectors of HDDs of hosts on the Cloud. |
If detected that the HDDs of hosts are in warning state, this may
cause data reads and writes of VM instances on the hosts to get
stuck and affect application workloads running on the VM instances.
Troubleshooting:
|
| Host SSD | Check the health status, IO utilization, remaining life expectancy, and temperature of SDDs of hosts on the Cloud. |
If detected that the SSDs of hosts are in warning state,
troubleshooting:
If SSDs of hosts are in fault state, troubleshooting:
|
|
| Host RAID Card | Check the RAID card status and cache mode of hosts on the Cloud. |
If detected that the RAID card is degraded, the data redundancy may be affected. Check the health state of the RAID cards and process this problem as soon as possible. If detected that the cache mode of host RAID cards is not write-through, this may make storage services unable to be launched and data on the system volume unable to be resumed in case of power outage. Reset the cache mode of related host RAID cards to write-through. If detected that exceptions occur to host RAID cards, this may be because of RAID card faults or contact failures and may cause host system hangs and VM I/O stuck. Check whether related host RAID cards are in good health status and check whether there are warnings on RAID card failures on the out-of-band management interface. If there are RAID card failures, change the RAID cards as soon as possible. |
|
| Volume Snapshots | Check the number of snapshots created on a volume. | If detected that the number of snapshots of some volumes exceeds 20, this will lower VM performance, increase data security risks, and occupy storage space of primary storage. Clean up snapshots that are insensitive to your business as needed. | |
| Primary Storage Status | Check whether primary storages on the Cloud are disconnected. | If detected that primary storages on the Cloud are disconnected, check whether related primary storage is in normal status as soon as possible. | |
| Image Storage Status | Check whether image storage on the Cloud are disconnected. | If detected that image storage are disconnected, check whether the storage status of these image storage is abnormal. | |
| Used Physical Storage Space of Image Storage | Check the storage usage and utilization of primary storages on the Cloud. |
If detected that the storage usage of the image storage exceeds 70%, we recommend that you expand the storage capacity. If detected that the storage usage of the image storage exceeds 85%, clean up images insensitive to your business to free up some storage space and expand the storage capacity if necessary. |
|
| Used Physical Storage Space of Primary Storage | Check the storage usage and utilization of primary storages on the Cloud. |
If detected that the storage usage of the primary storages on the Cloud exceeds 70%, we recommend that you expand the storage capacities. If detected that the storage utilization of primary storages exceeds 85%, to prevent storage space fully occupied, clean up VM instances and volumes insensitive to your business so as to free up some storage space and expand the capacity of primary storages. |
|
| Distributed Storage Monitor Node State | Check whether the monitor node of distributed storage on the Cloud is well connected. | If detected that the monitor node of distributed storage on the Cloud is disconnected, check whether the distributed storage is normal state. | |
| Distributed Storage Status | Check whether the distributed storage on the Cloud is in normal health status. | If detected that the health status of the distributed storage on the Cloud is abnormal, log into the server system and check the system status of the distributed storage. | |
| Primary Storage Heartbeat Network | Check whether heartbeat networks are configured for primary storages on the Cloud. | If detected that heartbeat network is not configured for the primary storages of the Cloud, to ensure that you can monitor the health status of the Cloud primary storages, configure a heartbeat network as soon as possible. | |
| Global Setting | HA Policy of VM Instance | Check whether the global setting VM HA Policy of the Cloud is set to Force. | If detected that the high availability (HA) policy of VM instances is set to Permissive, HA is not supported for VM instances. To ensure high availability of business running on VM instances, go to Global Setting and reset the policy to Force. |
| Host Reserved Memory | Check whether the specified value of the global setting Host Reserved Memory well suits the actual business scenarios. | If detected that the reserved host memory is quite little, the system services of the Cloud occupies some memory. To ensure the smooth running of the system services, go to Global Setting and set the host reserved memory to at least 30 GB. | |
| Memory Overcommitment | Check whether the specified value of the global setting Host Memory Overcommitment well suits the actual business scenarios. | If detected that memory overcommitment is set to above 1, we recommend that you do not overcommit memory in the production environment. Memory overcommitment may cause host OOM errors. Go to Global Setting and set the memory overcommitment to 1. | |
| Primary Storage Overcommitment | Check whether the specified value of the global setting Primary Storage Overcommitment well suits the actual business scenarios. | If detected that primary storage overcommitment is set to above 1, we recommend that you do not overcommit primary storage in the production environment. Primary storage may cause all storage space to be fully occupied. Go to Global Setting and set the primary storage overcommitment to 1. | |
| Primary Storage Usage Threshold | Check whether the specified value of the global setting Primary Storage Usage Threshold well suits the actual business scenarios. | If detected that the usage threshold set for primary storages on the Cloud is quite high, to prevent excessive usage of primary storage space, go to Global Setting and set Primary Storage Usage Threshold to 0.85. | |
| Reserved Storage of Primary Storage | Check whether the specified value of the global setting Primary Storage Reserved Capacity well suits the actual business scenarios. | If detected that the reserved storage space of primary storage is quite little, go to Global Setting and set the reserved storage space to 200 GB. | |
| Reserved Storage Space of Image Storage | Check whether the specified value of the global setting Image Storage Reserved Capacity well suits the actual business scenarios. | If detected that the storage space reserved for image storage is quite little, go to Global Setting and set the reserved storage space to 200 GB. |
 Note:
Note: