Message Log
Alarm Message
An alarm message is a message sent the time when an alarm is triggered.
You can view the statistical graphs and details of alarm messages on the Cloud. You can also view third-party alarm messages on the Extended Alarm Message page.
Current Task
A current task is an ongoing operation performed in the Cloud. You can perform centralized management over ongoing operations.
The current task page includes two tabs: Cloud Operation Task and Auto-Scheduling Task.
Cloud Operation Task
On the main menu of ZStack Cube Ultimate, choose . Then, the Cloud Operation Task page is displayed.
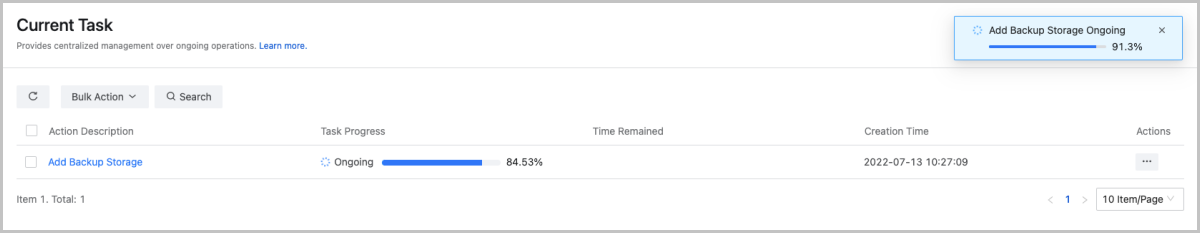
- The progress bar displays the task progress in real time. You can click the
x button to cancel the ongoing
task.
 Note: Currently, only some tasks cannot be canceled. For example,
you can cancel a ongoing migration task.
Note: Currently, only some tasks cannot be canceled. For example,
you can cancel a ongoing migration task. - You can search for ongoing tasks by operation description.
- You can adjust the number of ongoing tasks displayed on each page. Optional values: 10, 20, 50, and 100.
Auto-Scheduling Task
On the main menu of ZStack Cube Ultimate, choose . Then, the Current Task page is displayed. Click Auto-Scheduling Task. Then, the Auto-Scheduling Task tab is displayed.
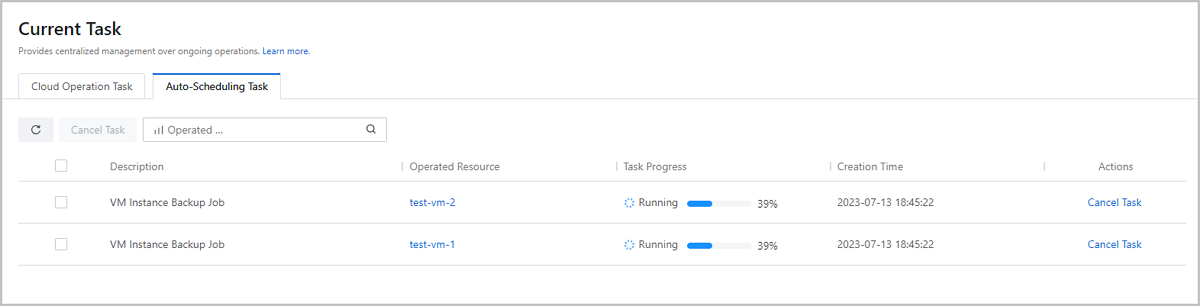
- The progress bar displays the task progress in real time. You can click the Cancel Task button to cancel the ongoing task.
- You can search for ongoing tasks by operated resource.
Operation Log
An operation log is a chronological record of operations on the specified objects and their operation results.
The Operation Log page includes two tab pages: Cloud Operation Logs and Auto-Scheduling Logs. ZStack Cube Ultimate supports centralized log management and log analytics with the artificial intelligence technology. You can implement fine-grained operation tracking and troubleshooting by viewing the operation logs together with audits to improve your O&M efficiency.
Cloud Operation Logs
On the main menu of ZStack Cube Ultimate, choose . Then, the Operation Log page is displayed. Click on Cloud Operation Logs. Then, the Cloud Operation Logs page is displayed.
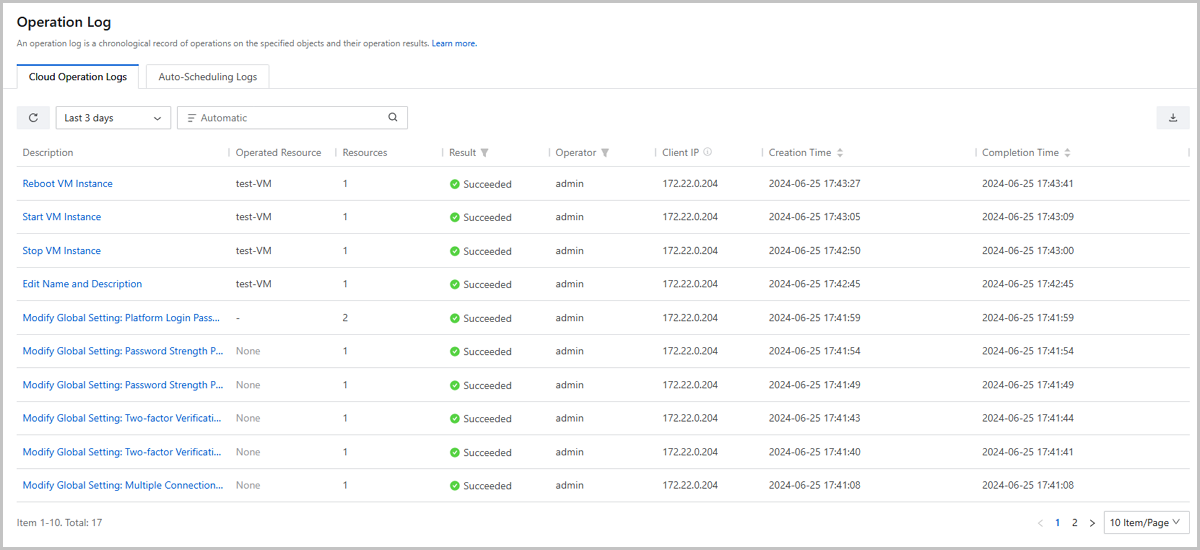
- You can select a time span to view the historic operations . Available time spans: 3 days, 7 days, and 1 month. By default, logs generated in recent 3 days are displayed.
- You can customize a time span to view the operation logs in the specified time span.
- You can search for operation logs by Operation Description, Client IP, or Operation Description + Client IP. The combined search criteria helps you find the logs more efficiently and precisely.
- You can filter operations by task result and operator. The task result include succeeded, failed, canceled, canceling, exception, timeout, paused, and unknown.
- You can sort the operations by creation time.
- You can export the operation logs in CSV format.
- You can adjust the number of operation logs displayed on each page. Optional values: 10, 20, 50, and 100.
- You can see the details of the APIs that are called when performing operations on the Cloud by checking the operation details page or using API Inspector.
Note:
- If your requests are forwarded to ZStack Cube Ultimate through a load balancer, correctly configure an X-Forwarded-For parameter for the load balancer. Without this parameter, the Cloud is unable to acquire your actual client IP and displays the load balancer IP here.
- By default, the cloud operation logs are retained for 90 days. You can
customize the retention period as needed. Method:
In Global Settings, set the value of Operation Log Retention Period.
- Too many operation logs might affect the performance of the management node. We recommend that you shorten the retention period if necessary to reduce the management node load.
Auto-Scheduling Logs
On the main menu of ZStack Cube Ultimate, choose . Then, the Operation Log page is displayed. Click on Auto-Scheduling Logs. Then, the Auto-Scheduling Logs page is displayed.
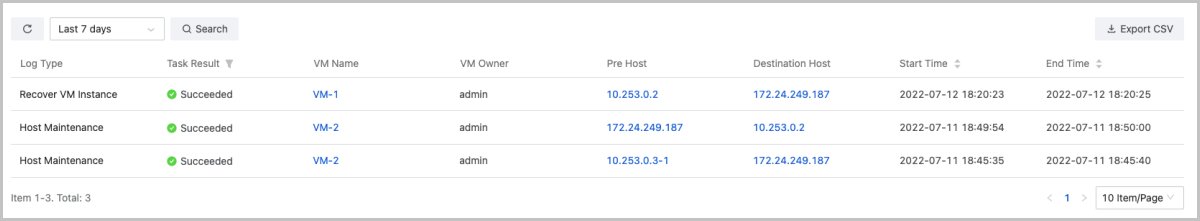
- You can select a time span to view the auto-scheduling logs . Available time spans: 3 days, 7 days, and 1 month. By default, logs generated in recent 7 days are displayed.
- You can customize a time span to view the auto-scheduling logs in the specified time span.
- You can search for auto-scheduling logs by VM name, VM owner, Pre Host, and Destination Host.
- You can filter auto-scheduling logs by task result. The task result include succeeded and failed.
- You can sort the auto-scheduling logs by creation time.
- You can export the auto-scheduling logs in CSV format.
- You can adjust the number of auto-scheduling logs displayed on each page. Optional values: 10, 20, 50, and 100.
- Click Task Description, you can enter the log details page to view more information.
Note: By default, the auto-scheduling logs are retained for 90 days. You can customize
the retention period as needed. Method:In Global Settings, set the value of Retention Period of Auto-Scheduling Logs.
Audit
Audit monitors and records all activities on the Cloud. You can use this feature to implement operation tracking, cybersecurity classified protection compliance, security analysis, troubleshooting, and automatic O&M. The operations that can be tracked include operations performed by using the console, API calls, accessing and managing cloud resources by using developer tools.
Log Collection
Log Collection
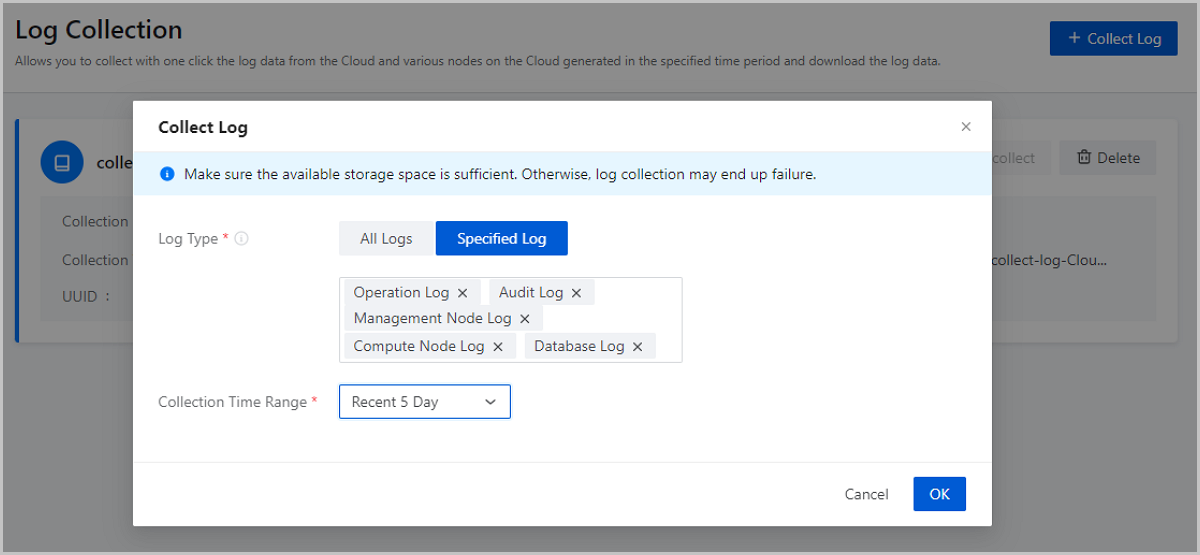
Allows you to collect with one click the log data from the Cloud and various nodes on the Cloud generated in the specified time period and download the log data.
Collect Log
On the main menu of ZStack Cube Ultimate, choose . Then, the Log Collection page is displayed.
- Log Type: Select the type of logs that you need to
collect. All Logs and Specified Logs are supported.
- If you select All Logs, you can collect all logs from the Cloud, including the logs of the management nodes, compute nodes, image storage, primary storage, VPC vRouters, and databases, operations logs, and audit logs.
- If you select Specified Logs, you can specify one or more categories of logs or collect all logs of the Cloud all at once. If you specify one or more categories of logs, for example, compute node logs, the logs of all compute nodes on the Cloud generated at the specified time period are collected.
- Collection Time Range: Specify the time range of the log collection. You can specify recent 1 day, recent 3 days, recent 5 days, or customize a time range. You can specify a maximum of 5 days for log collection.
 Note:
Note:
- You can collect at most 3 logs on the Cloud. To collect more logs, you need to delete previously collected logs.
- After a log is collected, you can copy Log URL to download the log. Before you use the URL to download the log, make sure that the environment used for the download is connected to the management network of the Cloud.
Manage Log
On the main menu of ZStack Cube Ultimate, choose . Then, the Log Collection page is displayed.
| Action | Description | Log Collection Status |
|---|---|---|
| Collect Log | Collect a specified log generated in the specified time
range.Note: You can collect up to three log files. To collect
more log data, delete the collected log files first as
needed. |
/ |
| Cancel | Cancel log collection. After you cancel the collection, you need to manually delete the collected part. | Collecting |
| Download Log | Download a log, | Succeeded |
| Recollect Log | Recollect a log which fails to be collected. | Failed |
| Delete Log | Delete a log. | Succeeded/Failed |
| Delete All Logs | If the collected log amounts to 3, you can delete all logs with one click. | Succeeded |
Collect Log
On the main menu of ZStack Cube Ultimate, choose . Then, the Log Collection page is displayed.
- Log Type: Select the type of logs that you need to
collect. All Logs and Specified Logs are supported.
- If you select All Logs, you can collect all logs from the Cloud, including the logs of the management nodes, compute nodes, image storage, primary storage, VPC vRouters, and databases, operations logs, and audit logs.
- If you select Specified Logs, you can specify one or more categories of logs or collect all logs of the Cloud all at once. If you specify one or more categories of logs, for example, compute node logs, the logs of all compute nodes on the Cloud generated at the specified time period are collected.
- Collection Time Range: Specify the time range of the log collection. You can specify recent 1 day, recent 3 days, recent 5 days, or customize a time range. You can specify a maximum of 5 days for log collection.
Note
- You can collect at most 3 logs on the Cloud. To collect more logs, you need to delete previously collected logs.
- After a log is collected, you can copy Log URL to download the log. Before you use the URL to download the log, make sure that the environment used for the download is connected to the management network of the Cloud.
Manage a Log
On the main menu of ZStack Cube Ultimate, choose . Then, the Log Collection page is displayed.
| Action | Description | Log Collection Status |
|---|---|---|
| Collect Log | Collect a specified log generated in the specified time
range.Note: You can collect up to three log files. To collect
more log data, delete the collected log files first as
needed. |
/ |
| Cancel | Cancel log collection. After you cancel the collection, you need to manually delete the collected part. | Collecting |
| Download Log | Download a log, | Succeeded |
| Recollect Log | Recollect a log which fails to be collected. | Failed |
| Delete Log | Delete a log. | Succeeded/Failed |
| Delete All Logs | If the collected log amounts to 3, you can delete all logs with one click. | Succeeded |